If going through housekeeping checklists leaves you exhausted, we've got some great news! Discover Checklist Dashboard, our latest product update that collects data from filled-out checklists and brings an overview of the quality offered at your property. This powerful new tool helps you:
- Keep track of all the checklists at once
- Easily identify your departments' strengths and weaknesses
- See the top 5 failed checks and who's responsible
- Optimize quality control of failed responses
- View all your hotel's data in one place
- Extract great reports for maximum efficiency
Sounds great, right? It was your idea!
"Looking for things that repeatedly went wrong was such a drag."
"I lost hours trying to find the checklists I'm sure I've completed."
"There must be a way to handle checklists without going through each and every one of them."
Once upon a time, going through housekeeping checklists was about as fun as a cold and rainy day on a beach holiday. We listened to your complaints and brought your voice to our product decisions. Meet Checklist Dashboard, our latest product update is set to become one of the most impactful tools for the modern housekeeping supervisor.
How many hotel checklists would a checker check if he checked a Checklist Dashboard?
Before you could even say that sentence out loud, you'd be done with your checklist overview. That's how efficient the new Checklist Dashboard is. Let's take a quick video tour through its key features:
How does the Checklist Dashboard work?
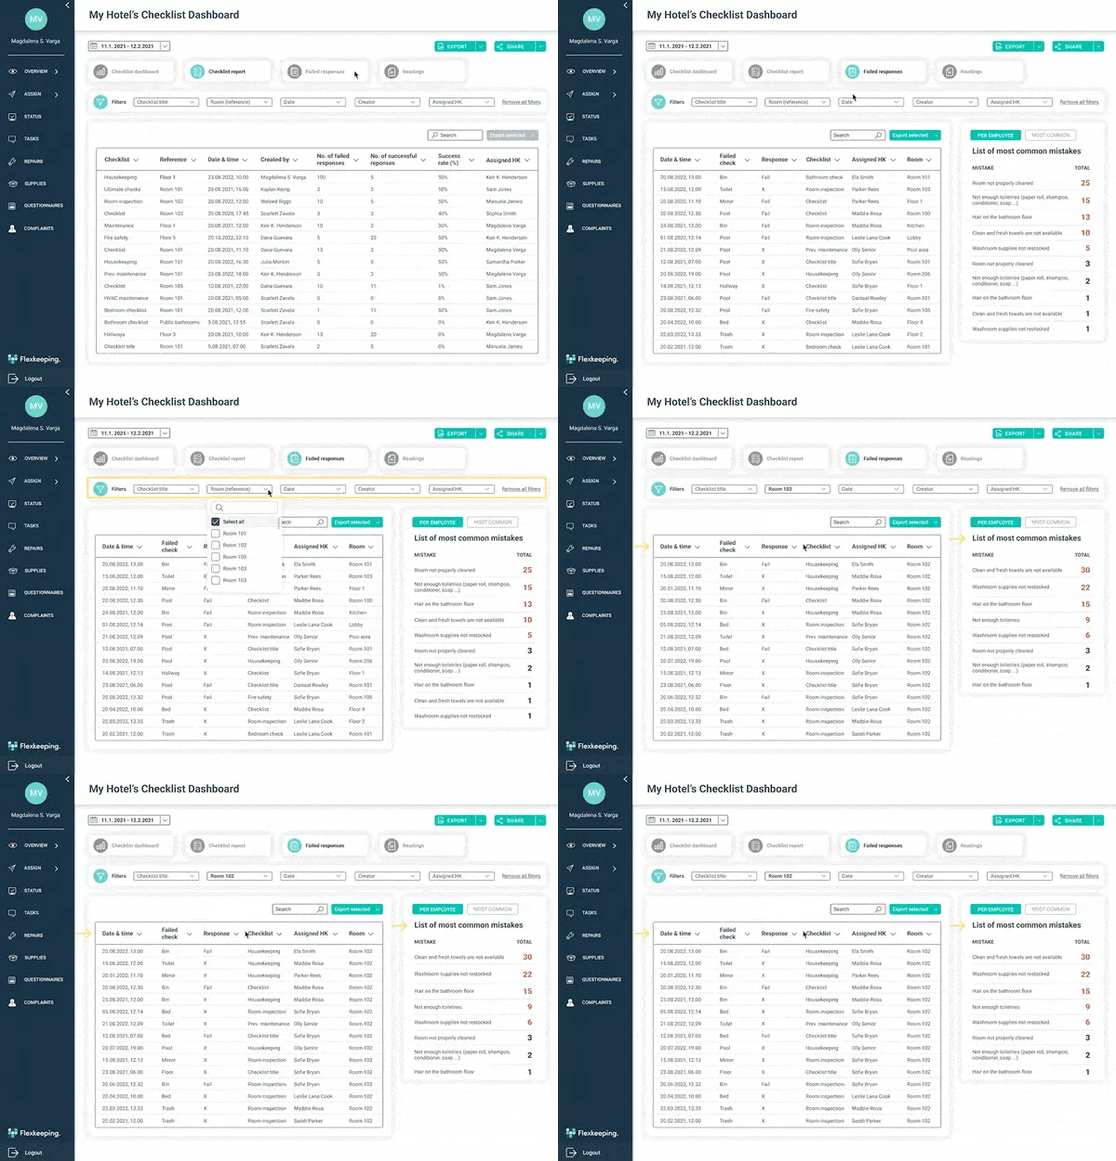
This powerful tool provides 4 different data pages/reports, consolidating data from all the forms you have filled out.
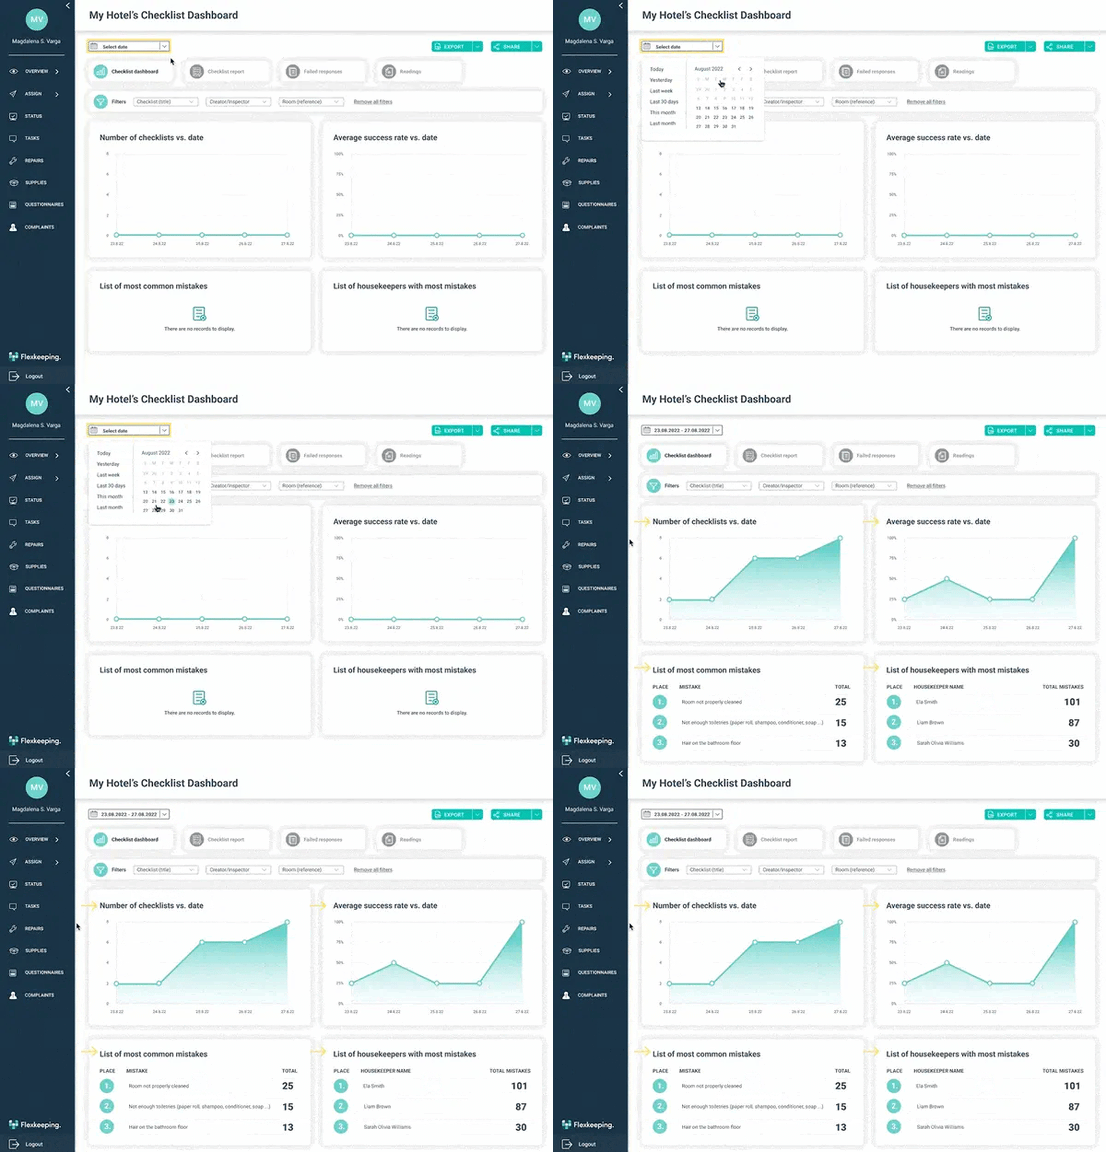
2. The second tab is the Checklist archive. The archive replaces the old overview, where you can download the checklists. The table includes all the blank checklists within the chosen time frame. Clicking on one gives you a preview of what that checklist would contain. You can quickly find the perfect checklist by filtering things like name, date of creation, or room it was filled out in. You can even filter by the assigned employees if it was already assigned.
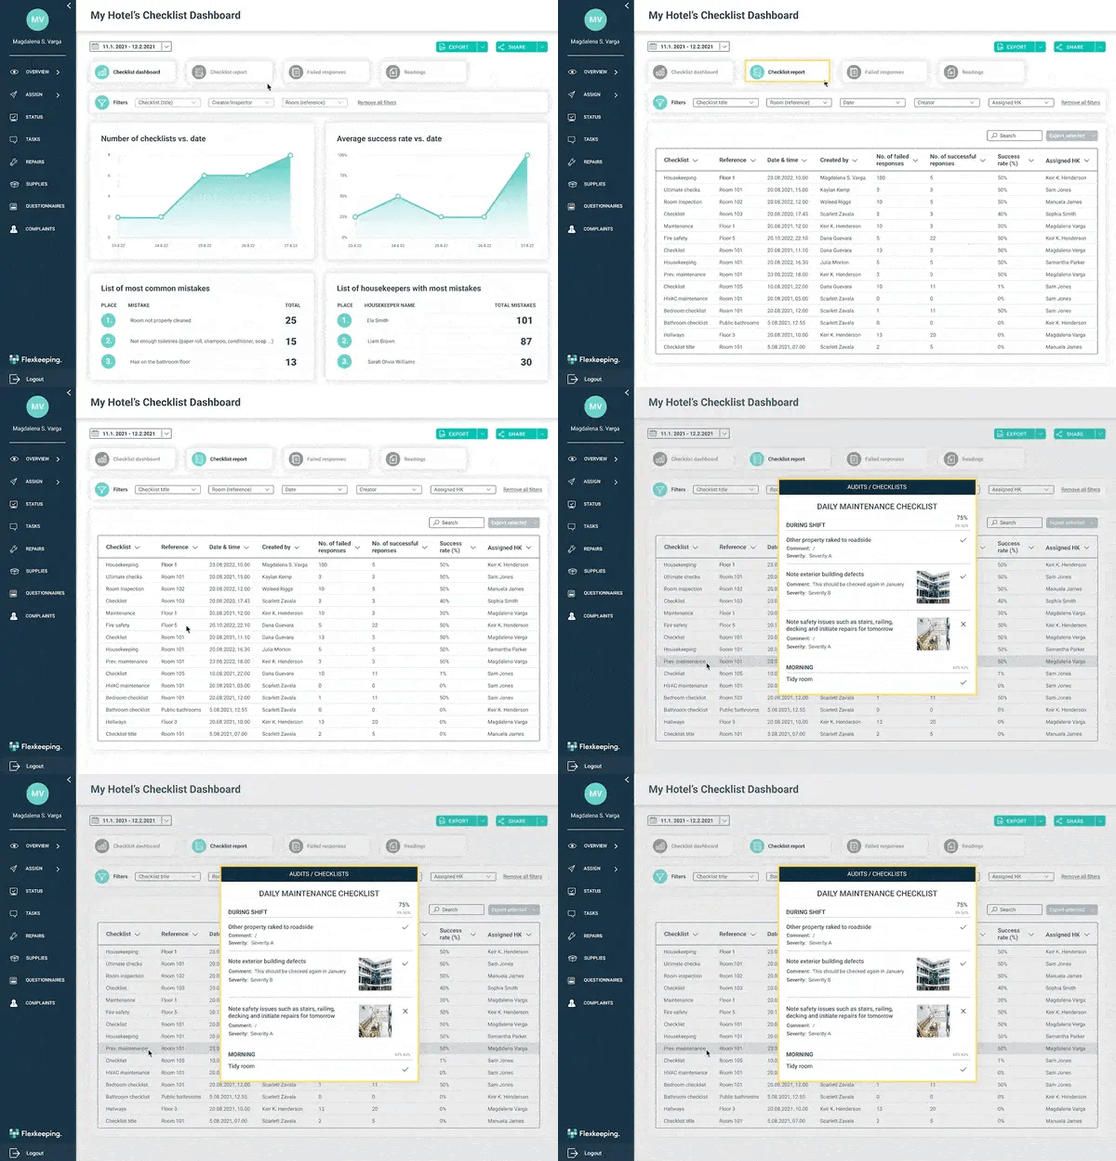
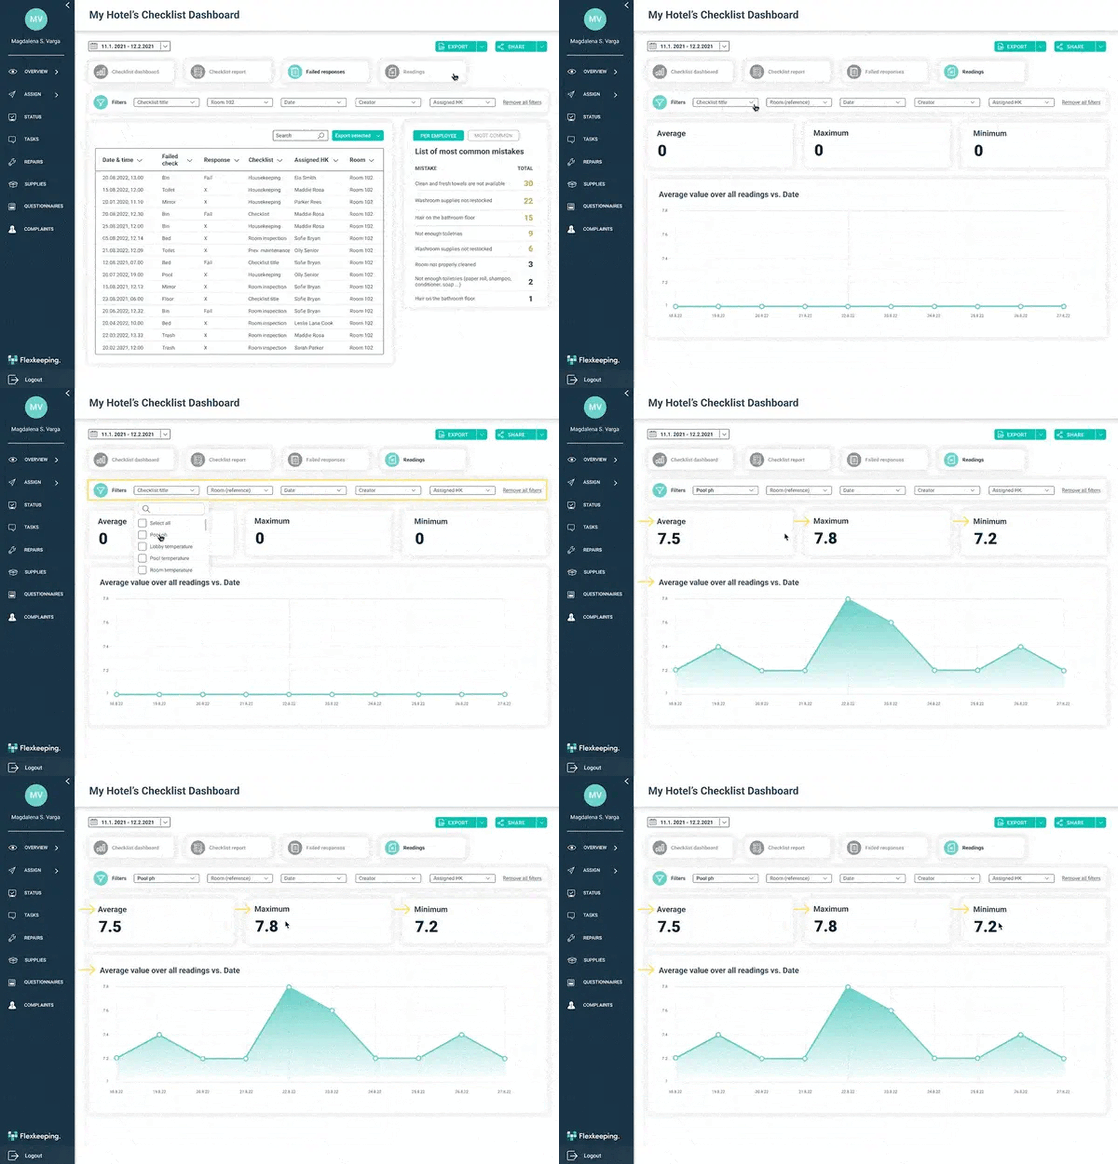
3. On the third report, we will evaluate failed responses. When a response is marked as failed (red), you will see it in this report. Table 1 will show all failed checks and responses for the selected period, while the side list will rank them by the most common ones or by the responsible employee.
4. The last report on the platform simplifies readings. A user is required to enter a number, such as a temperature or item quantities. While the graph shows the records entered in a specific timeframe, the cards above calculate the average and show the maximum or minimum reading for that period. If you select different readings, the data may not be representative of what you are looking for.
How can you get it?
The dashboard is automatically added to any management group that already has the old Checklist Overview. You will find it under Overview or Analytics. Please get in touch with us if you don't use the Checklists module at your property, and we'll have it sorted.
- If you are already part of the Flexkeeping family but don’t have access to the Analytics module, contact our Support heroes.
- If you are new to Flexkeeping, Book a Demo.
Either way, we’ll get you started in minutes. ✅
... and we almost forgot, the whole Checklist dashboard is... ⬇️
Fully adapted to your needs
Whether it's a list of checklists or responses, you can see a preview, print it out, or save it as a PDF.
